
Guikits Journal
How to Use an Online Assembler / Disassembler for Faster Debugging, Reverse Engineering, and Learning
A deep practical guide to Guikits Assembler / Disassembler: architecture support, round-trip workflows, opcode verification, reverse-engineering checks, and when a browser tool beats a full local toolchain.
Quick summary
A deep practical guide to Guikits Assembler / Disassembler: architecture support, round-trip workflows, opcode verification, reverse-engineering checks, and when a browser tool beats a full local toolchain.
Why an online assembler / disassembler is more useful than it sounds
Most low-level developers already know how to use a native toolchain. You can assemble with platform tools, inspect instructions with objdump-style utilities, and decode bytes inside a debugger.
So why keep a browser-based assembler / disassembler open?
Because many real tasks are small, repetitive, and verification-heavy:
- “What bytes does this instruction become?”
- “If I patch these bytes, what instruction sequence do they decode to?”
- “Does this shellcode fragment still mean what I think it means?”
- “What changes between ARM, THUMB, x86, and x64 views?”
- “Can I sanity-check this snippet before I move back to the full environment?”
For those jobs, speed matters more than ceremony.
The Guikits Assembler / Disassembler is built for that exact loop: enter instructions or bytes, convert immediately, compare architecture-specific outputs, copy results, and feed an output back into the next pass without leaving the page.
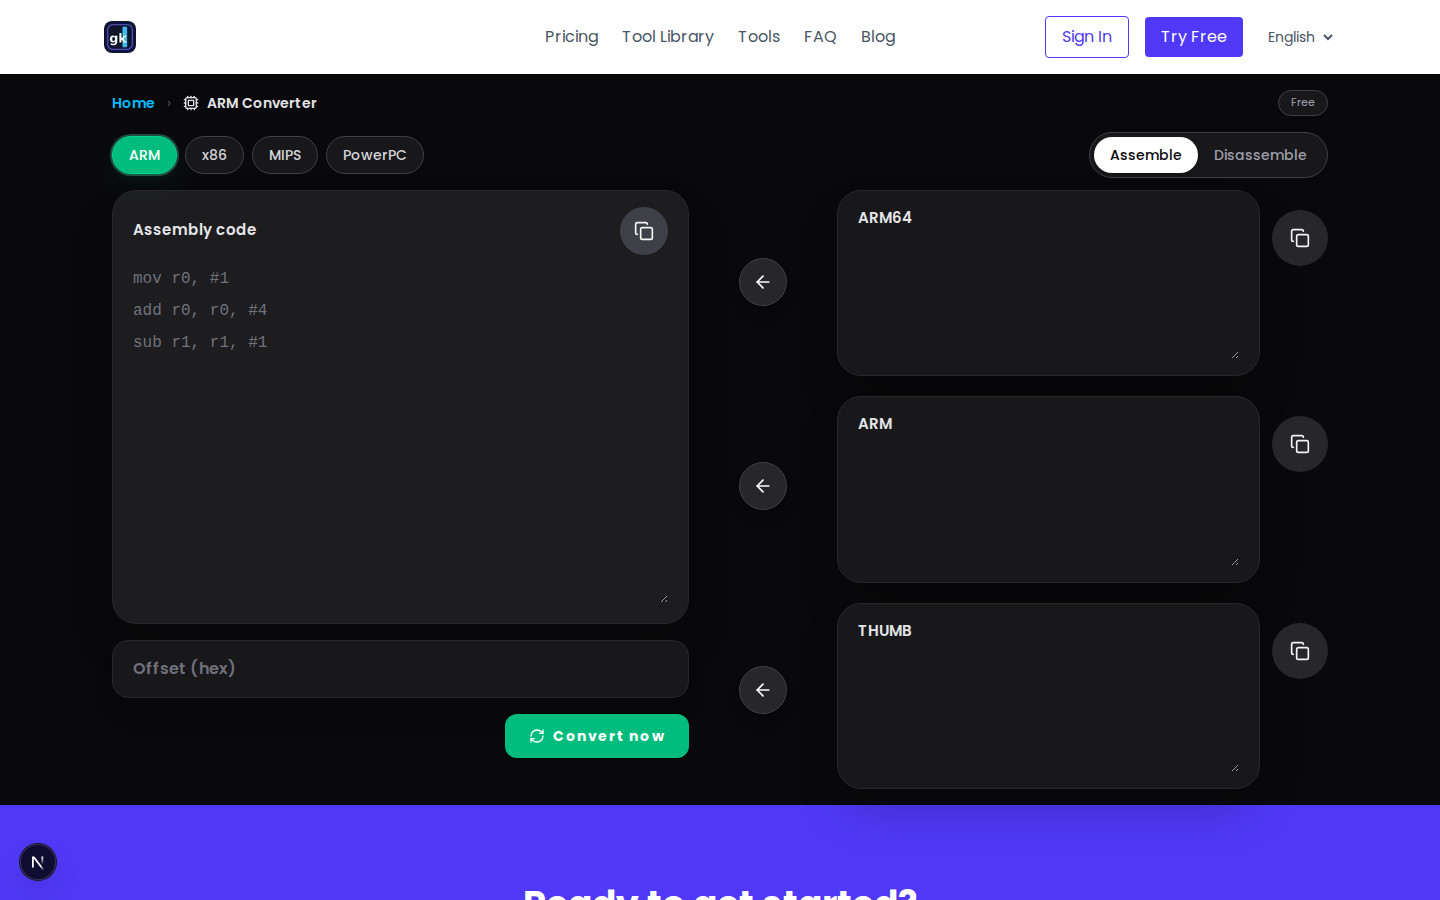
Online assembler / disassembler: quick answer
If you need the short version, the Guikits Assembler / Disassembler is best for:
- converting assembly to machine code
- decoding machine code bytes back into readable instructions
- comparing outputs across ARM, x86, MIPS, and PowerPC families
- verifying shellcode, patches, firmware snippets, and short debugging samples
- doing quick round-trip checks before moving into a heavier local toolchain
Try the live tool here: /assembler-disassembler
What the Guikits tool actually does
The page supports two directions:
- Assemble: convert readable assembly into machine code
- Disassemble: convert machine code bytes back into readable instructions
It supports four architecture families:
- ARM
- x86
- MIPS
- PowerPC
And it exposes relevant output panes for each family:
| Architecture family | Output panes |
|---|---|
| ARM | ARM64, ARM, THUMB |
| x86 | X64, X86 |
| MIPS | MIPS64, MIPS32 |
| PowerPC | PPC64, PPC32 |
That split matters. In low-level work, “assemble this” is often only half the question. The other half is “how does it look across the variants I care about?”
The real value: a round-trip workflow instead of a one-shot converter
A lot of online utilities are effectively text boxes with a submit button. They help once, then make you start over.
This tool is better when you use it as a round-trip workspace.
The core loop looks like this:
- Put assembly or machine code into the left editor
- Pick an architecture family and mode
- Convert
- Inspect the output panes on the right
- Click the arrow on a specific pane to send that output back into the input area
- Let the page switch direction automatically
- Run the next pass
That means the page is not just for generating an answer. It is for iterating toward confidence.
This is especially useful when you are:
- checking whether a patch still decodes correctly
- validating a short exploit or shellcode fragment
- comparing variants of the same mnemonic sequence
- teaching yourself what instructions become at the byte level
- writing documentation or educational notes with concrete examples
A practical example: verifying a small x86 snippet
Imagine you want to verify a short x86 sequence before dropping it into a deeper workflow.
Start in Assemble mode with an x86-family architecture and enter:
push ebp
mov ebp, esp
sub esp, 0x10
xor eax, eax
Convert it and review the output panes.
What you care about is not only the raw bytes. You also care that:
- the encoding looks plausible
- the sequence is in the order you intended
- the byte-level output can be copied elsewhere without cleanup
Now click the arrow on the output pane, switch into Disassemble, and run the reverse pass.
That gives you a fast answer to a common debugging question:
If someone handed me only these bytes, would they decode back into the instruction sequence I think I generated?
That is a tiny workflow, but it happens constantly in reverse engineering, emulator work, debugging, and exploit prototyping.
A practical example: learning ARM / THUMB differences faster
ARM-family work is where multi-pane output becomes especially helpful.
Try a short instruction in Assemble mode and compare:
mov x0, x0
ret
When you work in a single-purpose utility, you often need separate steps to compare views or reconfigure modes manually.
Here, the outputs are already organized for comparison. That lowers the cognitive overhead when you are learning:
- which encodings are architecture-specific
- which mnemonics belong to which mode
- where an instruction makes sense in ARM64 versus ARM or THUMB
This is useful for:
- new low-level programmers
- firmware engineers hopping between instruction sets
- reverse engineers reading mixed references
- technical writers producing examples for multiple CPU families
Where the tool fits in a reverse-engineering workflow
Reverse engineering rarely starts with a complete, comfortable context. More often, you get fragments:
- a short byte string from a crash log
- a patched instruction sequence from a diff
- a shellcode sample from a write-up
- a suspicious opcode block from a firmware blob
In those moments, you do not always want to boot the full environment first.
A browser-based assembler / disassembler is valuable because it lets you answer small high-signal questions immediately:
- Is this byte string obviously valid or obviously wrong?
- Does this instruction sequence decode into what the report claims?
- If I tweak one line, do the bytes change as expected?
- Which pane gives me the interpretation closest to the target architecture?
That kind of rapid triage saves time before you move into IDA, Ghidra, LLDB, WinDbg, radare2, or a custom pipeline.
Why the offset field matters
The Offset (hex) field looks modest, but it solves a real problem.
Address-aware disassembly is often easier to reason about than disassembly starting from zero. Even when you are only looking at a short snippet, the offset gives you a way to preserve context from:
- a debugger view
- a firmware dump
- a binary patch note
- a vulnerability write-up
That means your quick verification pass can stay closer to the original environment.
Who should use this tool
This page is especially useful for five groups.
1. Reverse engineers
You need a fast place to decode bytes, compare instruction output, and validate short sequences before doing heavier analysis.
2. Security researchers
You often inspect shellcode, patches, proof-of-concept fragments, or opcode changes where rapid encode/decode checks matter.
3. Firmware and embedded developers
You may move across ARM, MIPS, or PowerPC families and need a lightweight comparison tool that does not force extra setup.
4. Students and self-learners
Seeing readable mnemonics turn into bytes — and back again — is one of the fastest ways to internalize how instruction encoding works.
5. Tool builders and technical writers
If you produce docs, tutorials, or test fixtures, a quick browser workflow is often the fastest way to generate small, clean examples.
When a browser tool beats a full local toolchain
A local toolchain is still the right answer for serious compilation, debugging, symbolic analysis, and integration work.
But a browser tool wins when the job is:
- short — a handful of instructions or bytes
- interactive — you expect several quick iterations
- comparative — you want multiple panes at once
- exploratory — you are still asking “what is this?”
- communicative — you need to copy results into docs, chats, or notes fast
That is why the right mental model is not “browser tools replace native tools.”
It is:
Browser tools compress the time between curiosity and verification.
A good workflow for debugging with this tool
If you want to get the most out of the page, use this sequence:
Workflow A: assembly to bytes
- Pick the architecture family
- Stay in Assemble mode
- Enter one short snippet, not a giant block
- Convert
- Compare the relevant output panes
- Copy the byte sequence you need
Workflow B: bytes to instructions
- Switch to Disassemble
- Paste a compact hex string
- Set an offset if you have one
- Convert
- Compare the decoded panes
- Use the output in notes or as a cross-check against another tool
Workflow C: round-trip verification
- Assemble a snippet
- Take one output pane
- Send it back into input with the arrow button
- Let the tool switch direction automatically
- Disassemble it
- Confirm the result matches your expectation
This third workflow is the one most people underuse. It is also the one that makes the tool genuinely productive instead of merely convenient.
A few best practices
Keep snippets small
This tool is best when you are validating compact instruction sequences, not entire binaries.
Compare intent, not just bytes
A matching byte string is useful, but the deeper question is whether the decoded output still reflects the semantic intent you wanted.
Use the right pane deliberately
If you are in an architecture family with multiple views, pick the pane that matches your target instead of assuming the first output is the one you need.
Use round-trip checks whenever the stakes rise
If the code is destined for patching, exploitation, firmware modification, or published documentation, run at least one reverse pass.
What this tool does not replace
It is worth being direct here: an online assembler / disassembler is not a full reverse-engineering platform.
It does not replace:
- a real debugger
- symbolic execution
- binary diffing platforms
- full-project build systems
- deep disassembler databases
- emulator-backed runtime inspection
What it replaces is the friction around the first few minutes of analysis.
That is a meaningful distinction. In practice, many expensive mistakes happen because people skip fast verification steps at the beginning.
Why this matters for learning
For learners, the browser format removes a lot of intimidation.
You do not need to memorize a giant workflow just to answer beginner questions like:
- What does this mnemonic become as machine code?
- What happens when I change this register?
- How does an instruction decode when I paste the bytes back in?
- Why does this architecture family expose multiple output panes?
Fast feedback builds intuition. Intuition makes the heavier tooling easier later.
Final takeaway
The Guikits Assembler / Disassembler is most valuable when you treat it as a fast verification workspace rather than a novelty converter.
Its strengths are practical:
- bidirectional conversion in one page
- architecture-family-aware output panes
- copy-ready results
- address-aware disassembly with offsets
- round-trip iteration via one-click output reuse
If your work includes debugging, reverse engineering, firmware inspection, shellcode validation, or low-level learning, this is the kind of tool that earns a permanent browser tab because it shortens the path from question to answer.
Try it here: /assembler-disassembler
Author
Guikits Team
Publishing practical notes, product experiments, and implementation patterns from active Guikits workflows.
Next Reads
Related articles
May 19, 2026 • 6 min read
Assembler / Disassembler Tool: Features, Use Cases, and How to Work Faster
assembler • disassembler • reverse-engineering
May 16, 2026 • 3 min read
How We Structure Tool Landing Pages for Search, AI Discovery, and Real Human Scanning
seo • geo • landing-pages
May 18, 2026 • 3 min read
Why Small Browser Tools Beat Heavy Workflows for Daily Debugging
developer-tools • debugging • workflow
Most stories are tied to active workflows. Continue with a hands-on pass in the tools section when you are ready to apply the ideas.