
Guikits Journal
Assembler / Disassembler Tool: Features, Use Cases, and How to Work Faster
A practical guide to the Guikits Assembler / Disassembler tool, including supported architectures, round-trip editing workflow, and examples for faster debugging and opcode inspection.
Quick summary
A practical guide to the Guikits Assembler / Disassembler tool, including supported architectures, round-trip editing workflow, and examples for faster debugging and opcode inspection.
What this tool is for
The Guikits Assembler / Disassembler tool is designed for a very practical workflow:
- write assembly
- convert it into machine code
- inspect the output across architecture variants
- move the result back into the input side
- switch direction and continue debugging
That makes it useful for developers, low-level learners, reverse engineering practice, quick opcode inspection, and lightweight round-trip debugging.
Instead of jumping between multiple utilities, the tool keeps the editing and comparison flow in a single workspace.
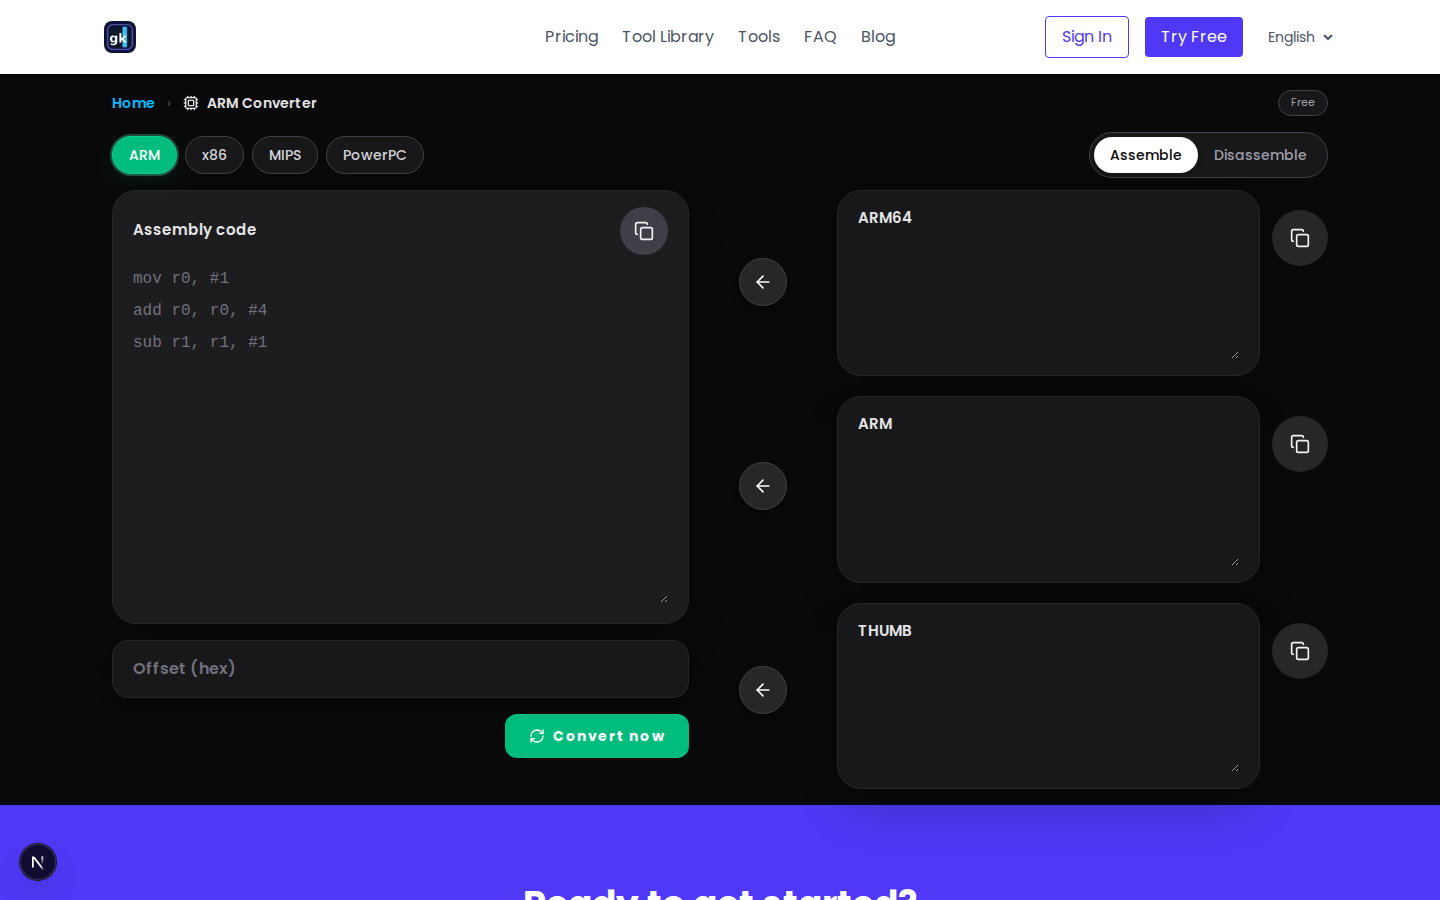
The tool keeps source input on the left, result panes on the right, and round-trip controls in the middle.
What the tool supports
At the moment, the tool is organized around four architecture families:
- ARM
- x86
- MIPS
- PowerPC
Depending on the architecture, the result area also breaks output into useful panes, such as:
- ARM64 / ARM / THUMB
- X64 / X86
- MIPS64 / MIPS32
- PPC64 / PPC32
This is useful because the same source-side intent often needs to be compared across related targets.
Core features
1. Assemble and disassemble in the same page
You can switch between:
- Assemble: convert assembly into machine code
- Disassemble: convert machine code back into readable instructions
That sounds simple, but the value is in not having to leave the page or rewrite your setup every time you change direction.
2. Fast round-trip workflow
One of the most useful interactions in the current UI is the left arrow between the output panes and the source editor.
When you click it:
- the selected output is copied back into the left input editor
- the mode automatically switches between assemble and disassemble
This is especially helpful when you want to:
- inspect output quickly
- feed the result back for another pass
- test how machine code maps back into readable instructions
- iterate on a snippet while debugging
In practice, it makes the tool much more comfortable for repeated editing.
3. Multi-pane output comparison
For architectures with multiple relevant variants, the output area is split into separate panes.
That means you can compare results without manually rerunning separate tools or copying values into multiple windows.
This is useful for:
- comparing ARM-family outputs
- checking x64 vs x86 style outputs
- reviewing platform-specific encodings faster
4. Input placeholder guidance
When the source editor is empty, the tool shows context-aware example content.
Those hints update automatically when you change:
- CPU architecture
- assemble / disassemble mode
So the input area always suggests the right kind of content for the current state.
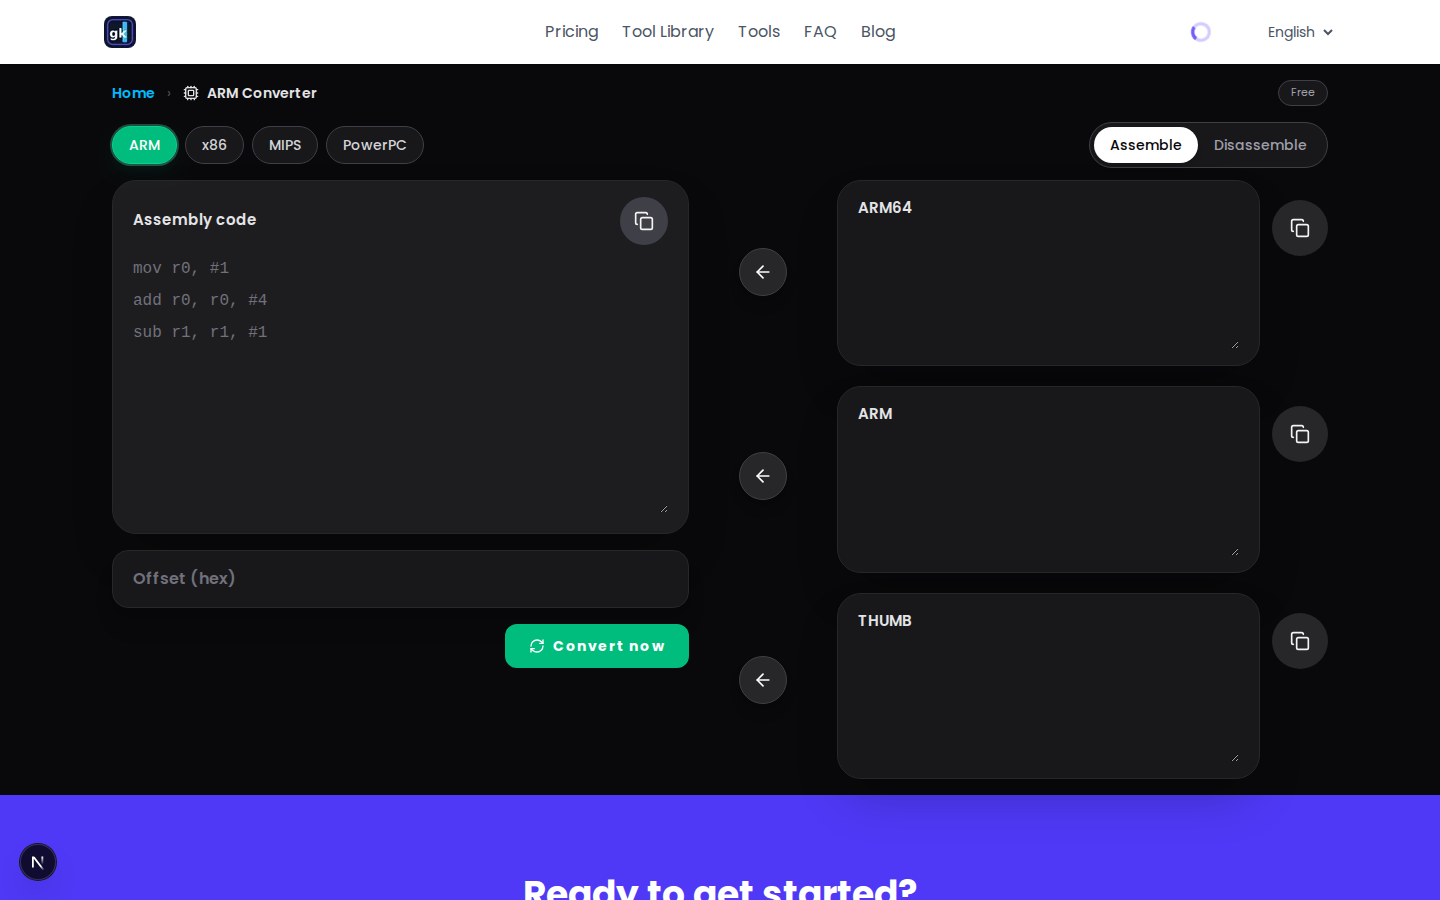
The editor has been tightened so the main conversion action stays visible on the first screen during normal desktop use.
5. Offset input for decoding workflows
The page includes an Offset (hex) field, which is useful when you want to work with address-aware disassembly scenarios.
Even in lightweight usage, having an offset field ready in the workspace reduces friction for inspection tasks.
6. One-click copy actions
Both source and output areas include copy actions, which helps when you want to:
- move bytes into another debugger or emulator
- paste instructions into documentation
- share an output snippet with teammates
It is a small feature, but it matters a lot in real debugging sessions.
Typical use cases
Learning assembly
If you are learning instruction formats, register usage, or encoding patterns, this tool gives you a very fast feedback loop.
You can type a small snippet, convert it, and immediately inspect the result without setting up a heavier environment.
Reverse engineering practice
When you are reading unfamiliar byte sequences or inspecting short opcode samples, the disassemble mode helps you quickly turn raw machine code into readable instructions.
Debugging and verification
If you are working on a compiler path, emulator logic, binary patching workflow, or low-level experiment, this tool is useful for quick verification.
Writing technical content or notes
Sometimes you just need a clean way to convert and compare snippets for:
- blog posts
- documentation
- internal notes
- educational material
A browser-based workflow is often faster than opening a full toolchain for small examples.
How to use the tool
Workflow 1: assembly to machine code
- Open the tool
- Choose an architecture such as ARM or x86
- Select Assemble
- Enter assembly in the left editor
- Click Convert now
- Review the result in the right-side panes
- Copy the relevant output if needed
Workflow 2: machine code to readable instructions
- Choose the architecture you want to inspect
- Switch to Disassemble
- Paste machine code into the left editor
- Optionally set a hex offset
- Click Convert now
- Review the decoded output
Workflow 3: round-trip editing
This is the most efficient loop for iterative work:
- Start in Assemble mode
- Convert your snippet
- Click the left arrow next to the output you want to inspect further
- The output is moved back into the source editor
- The tool automatically switches mode
- Run another conversion pass
This makes the page feel much closer to a real editing workspace than a one-shot converter.
Example: a realistic debugging loop
Imagine you are testing a short ARM snippet.
You start with assembly in the source editor. After converting, you review the generated bytes in the result area. Then you click the arrow beside the output pane you care about. The bytes move back into the left editor, the mode flips to disassemble, and you immediately run the reverse pass.
This gives you a quick answer to a practical question:
“Does the generated machine code map back to the instruction sequence I expect?”
That is exactly the kind of small but frequent task this tool makes easier.
Why this tool is useful even if you already have a full toolchain
A full assembler, debugger, or disassembler is still necessary for serious production workflows.
But browser-based tooling wins in situations where you care about:
- speed
- convenience
- lightweight iteration
- visual comparison
- quick learning loops
The Guikits Assembler / Disassembler tool is strong because it reduces the number of steps between “I want to test this idea” and “I can see the result now.”
Final takeaway
If you regularly work with assembly, opcodes, binary inspection, or architecture-specific debugging, this tool is built for a very practical workflow.
Its biggest strengths are:
- assemble and disassemble in one place
- architecture switching
- multi-pane output comparison
- fast round-trip editing via the arrow workflow
- low-friction copy and offset handling
If you want a fast way to modify, inspect, and debug assembly-related snippets, this is one of the most efficient workflows to keep open in a browser.
Try it here: /assembler-disassembler
Author
Guikits Team
Publishing practical notes, product experiments, and implementation patterns from active Guikits workflows.
Next Reads
Related articles
May 20, 2026 • 9 min read
How to Use an Online Assembler / Disassembler for Faster Debugging, Reverse Engineering, and Learning
assembler • disassembler • reverse-engineering
May 18, 2026 • 3 min read
Why Small Browser Tools Beat Heavy Workflows for Daily Debugging
developer-tools • debugging • workflow
May 16, 2026 • 3 min read
How We Structure Tool Landing Pages for Search, AI Discovery, and Real Human Scanning
seo • geo • landing-pages
Most stories are tied to active workflows. Continue with a hands-on pass in the tools section when you are ready to apply the ideas.